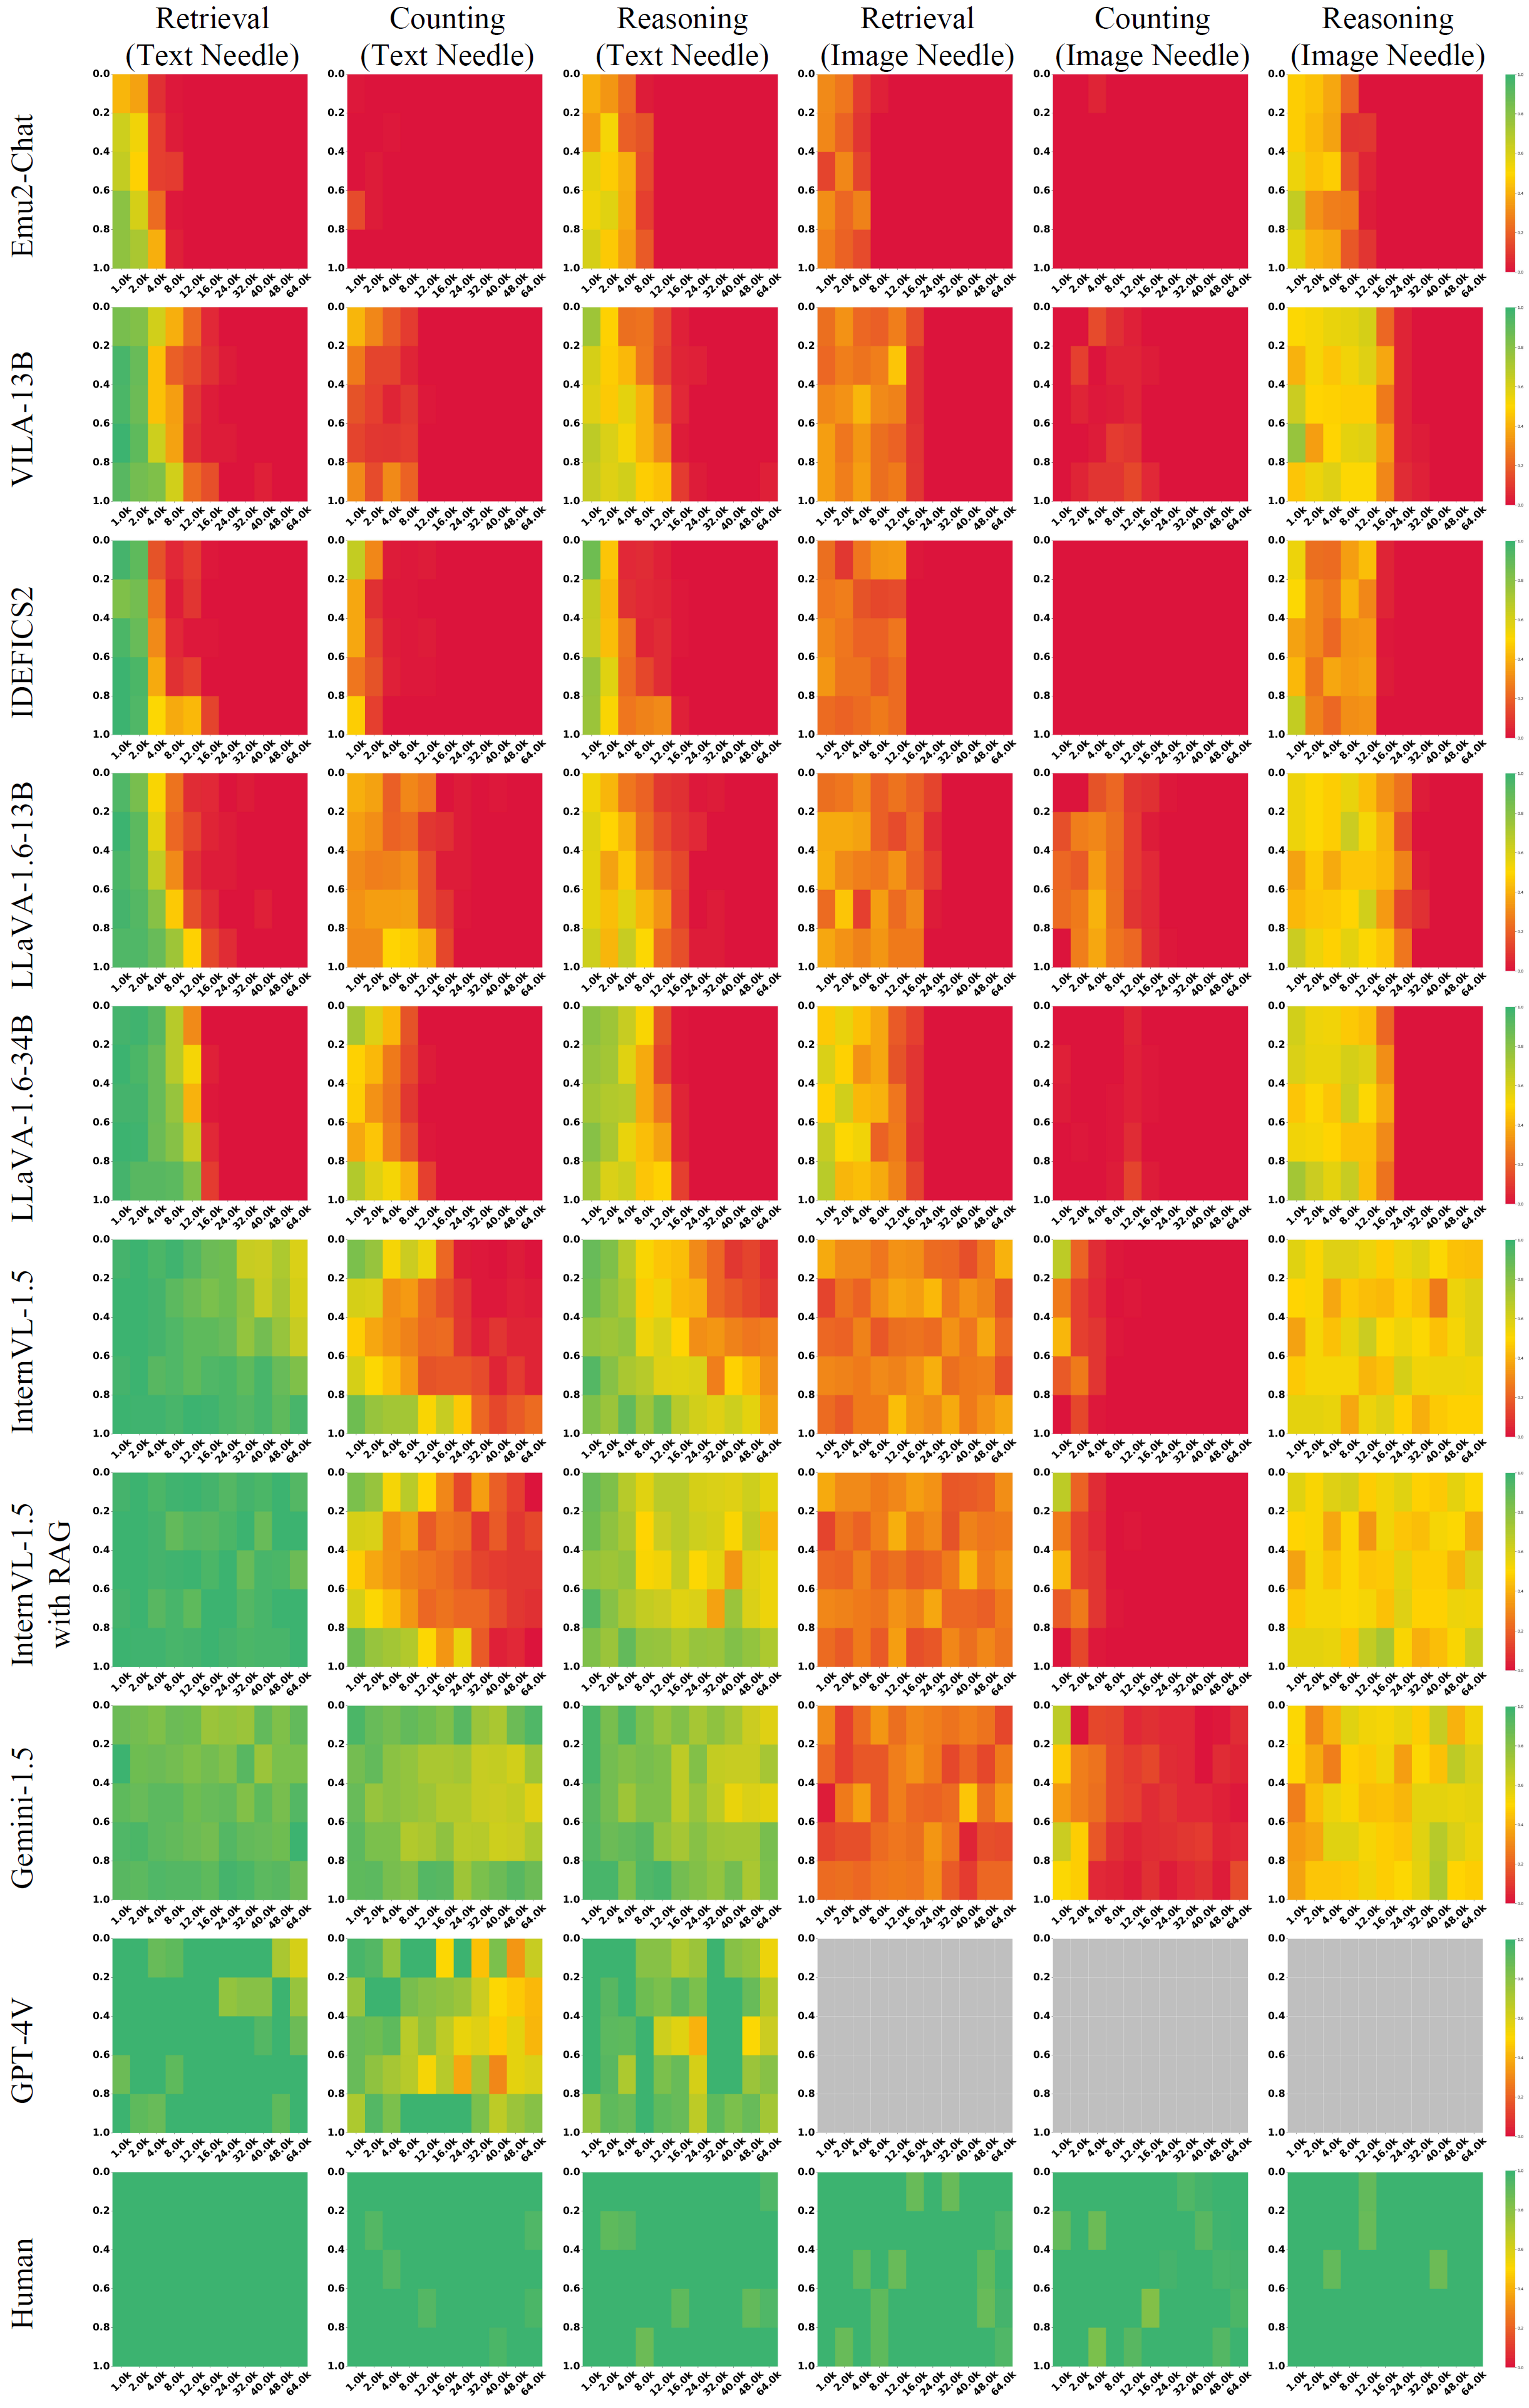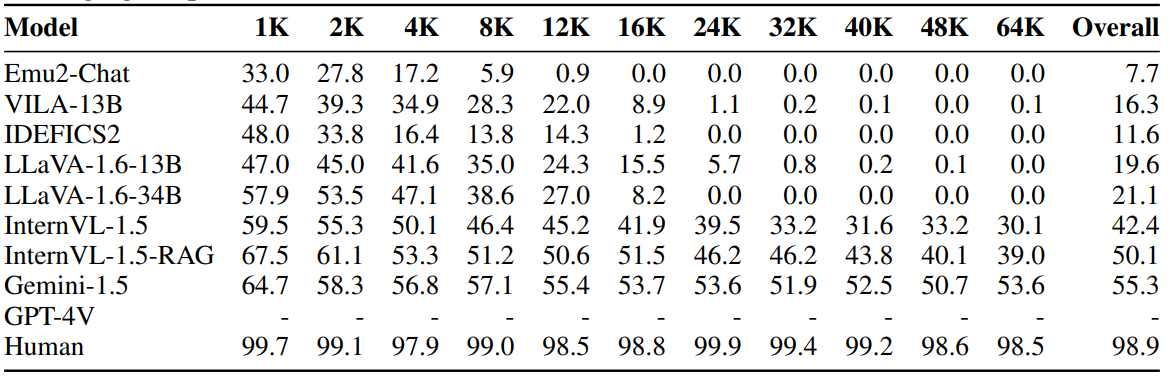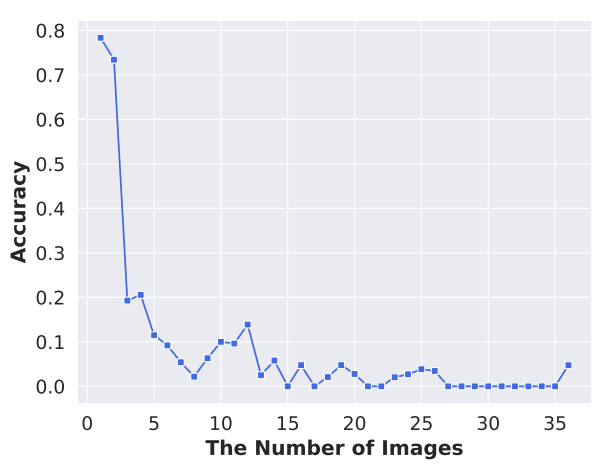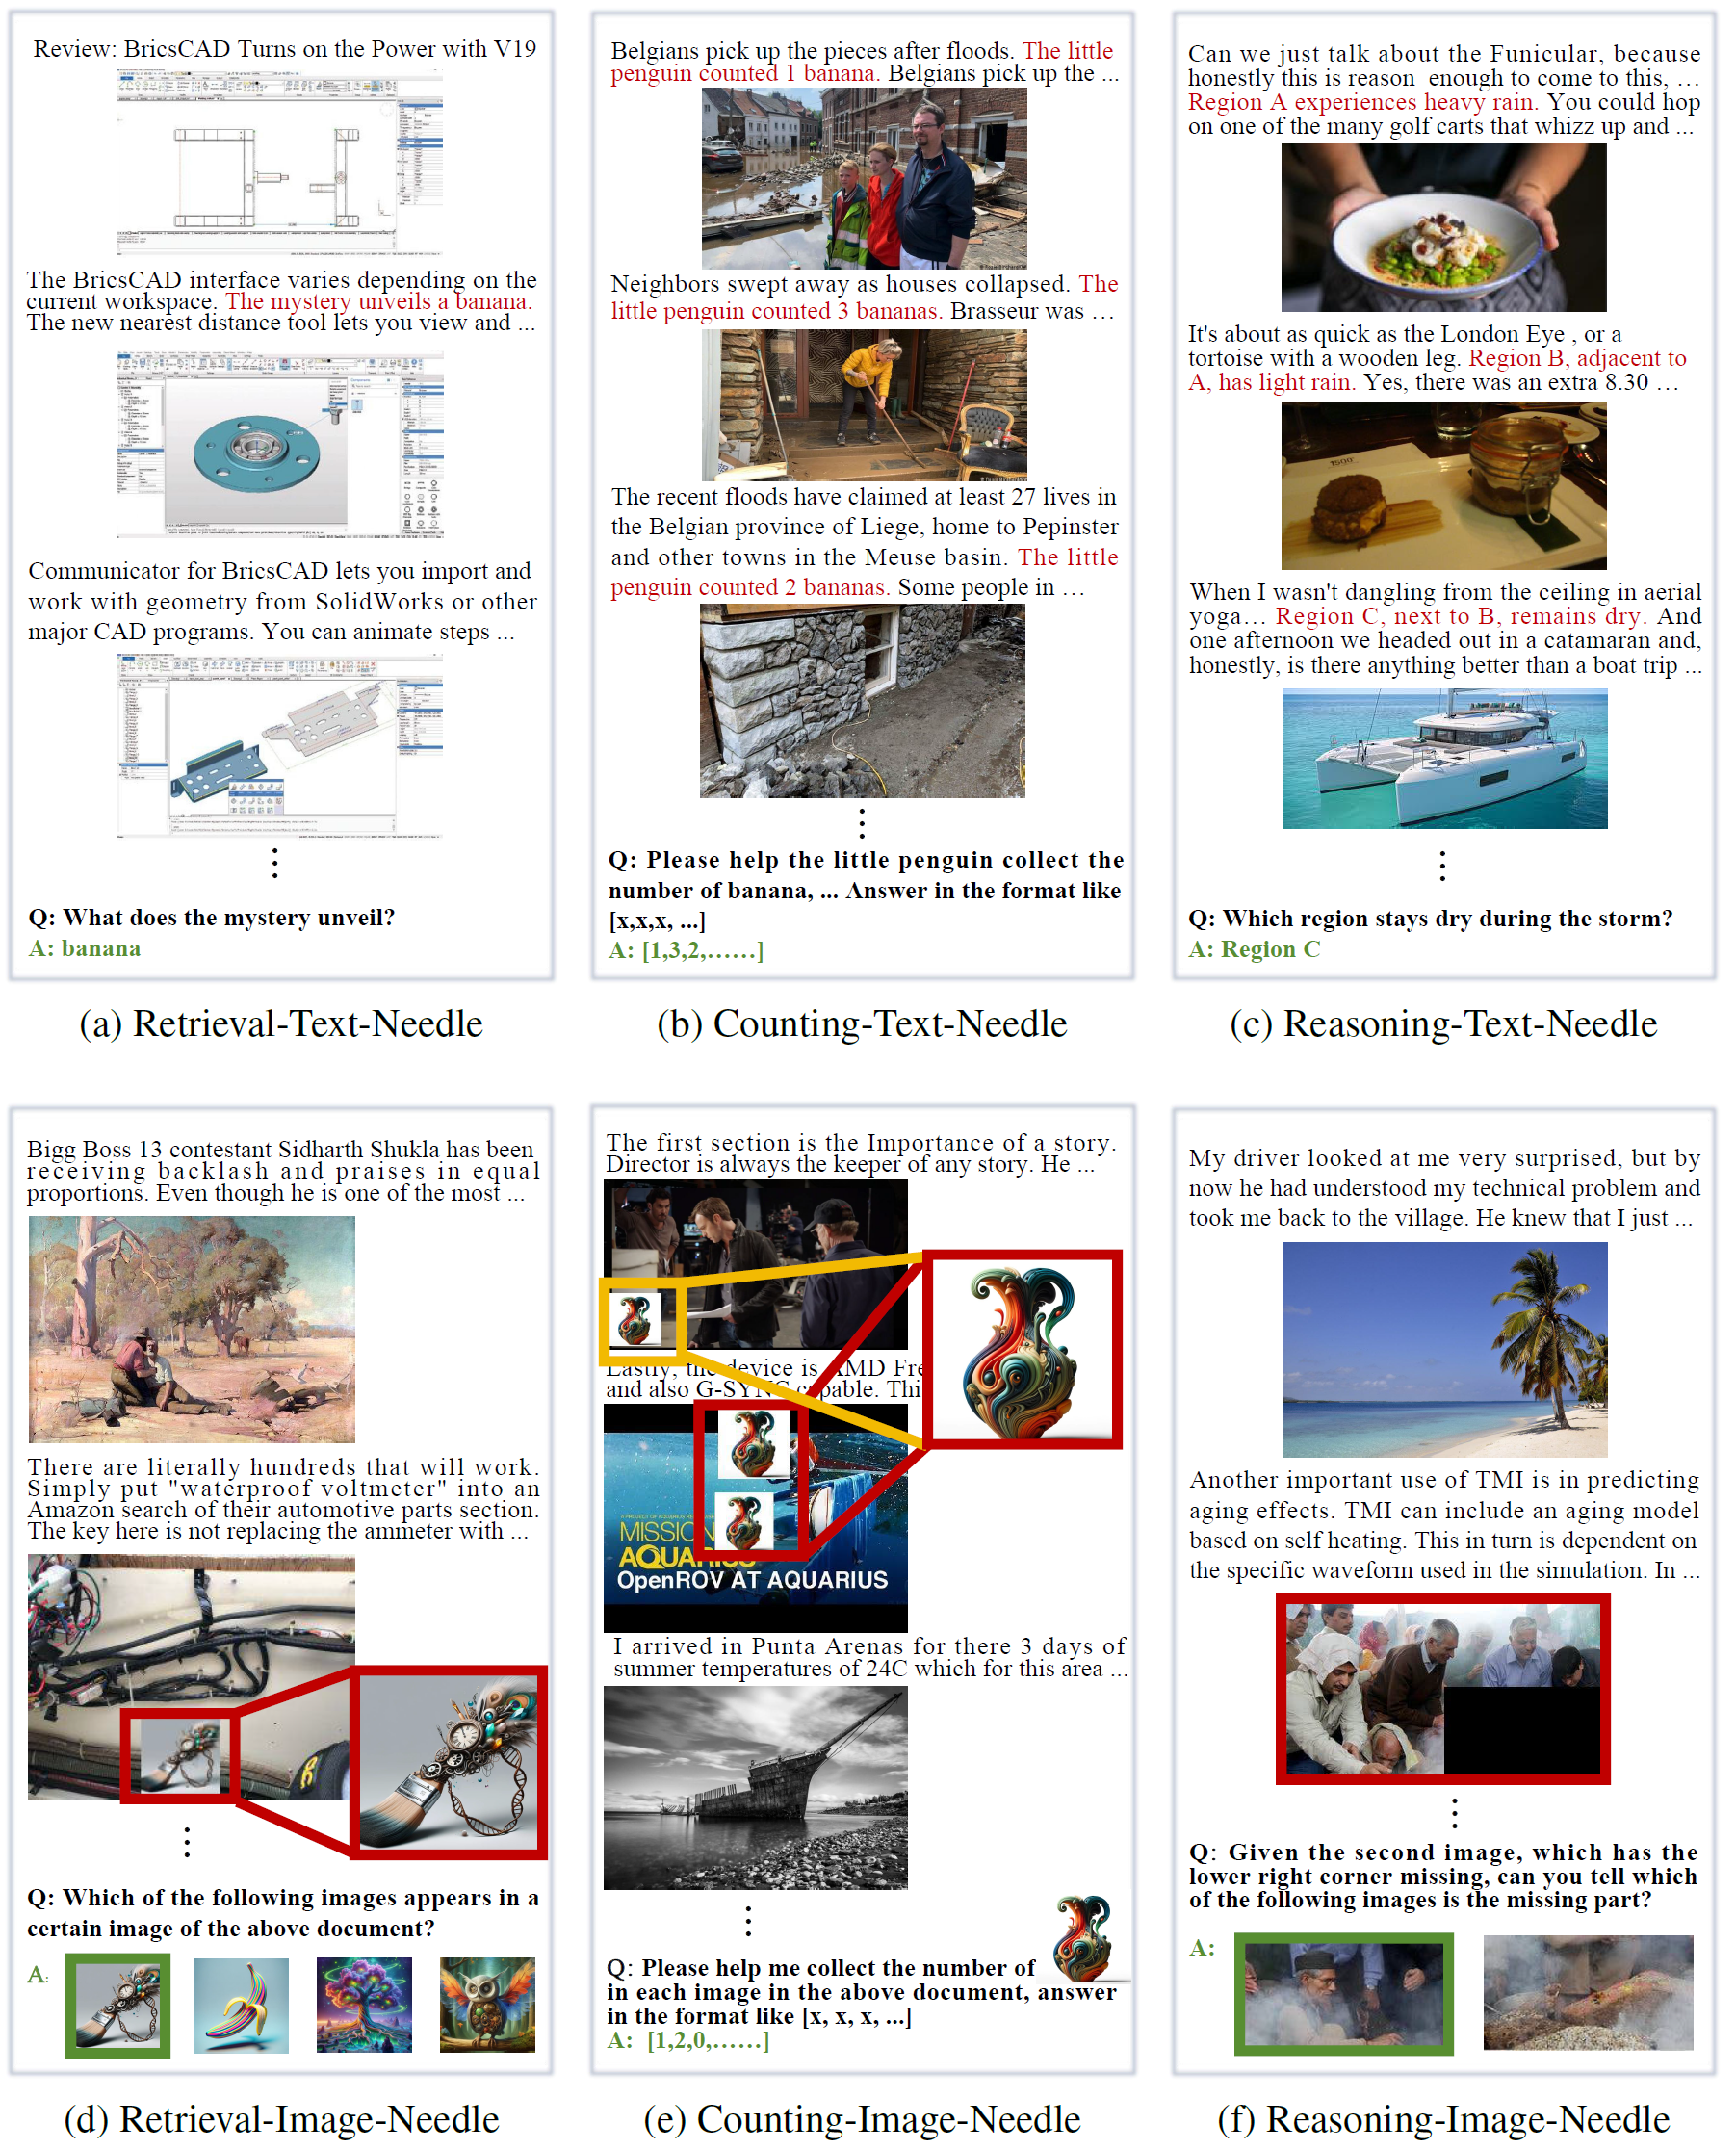

| Model | Retrieval-Text | |||||||||||
| 1K | 2K | 4K | 8K | 12K | 16K | 24K | 32K | 40K | 48K | 64K | Overall | |
| Human | 100.0% | 100.0% | 100.0% | 100.0% | 100.0% | 100.0% | 100.0% | 100.0% | 100.0% | 100.0% | 100.0% | 100.0% |
| InternVL-1.5 (w.RAG) | 99.4% | 99.6% | 99.1% | 99.0% | 98.0% | 96.5% | 96.3% | 96.1% | 94.1% | 95.3% | 94.9% | 97.1% |
| GPT-4V | 97.5% | 98.2% | 95.6% | 96.0% | 100.0% | 100.0% | 95.6% | 96.0% | 76.0% | 92.5% | 95.0% | 94.8% |
| InternVL-1.5 | 99.0% | 99.7% | 96.3% | 95.1% | 92.3% | 90.9% | 90.6% | 81.0% | 81.3% | 79.7% | 72.7% | 89.0% |
| Gemini-1.5 | 92.8% | 89.6% | 89.2% | 89.5% | 87.3% | 85.0% | 87.9% | 86.8% | 87.1% | 86.0% | 90.7% | 88.4% |
| LLaVA-1.6-34B | 98.5% | 96.5% | 89.9% | 77.3% | 53.8% | 4.3% | 0.0% | 0.0% | 0.0% | 0.0% | 0.0% | 38.2% |
| LLaVA-1.6-13B | 96.4% | 91.0% | 68.4% | 39.2% | 18.3% | 6.8% | 2.3% | 0.4% | 0.6% | 0.0% | 0.0% | 29.4% |
| VILA-13B | 93.7% | 86.6% | 59.2% | 38.5% | 15.2% | 6.8% | 0.9% | 0.0% | 0.7% | 0.0% | 0.0% | 27.4% |
| IDEFICS2 | 95.0% | 90.7% | 31.8% | 11.8% | 15.1% | 3.0% | 0.0% | 0.0% | 0.0% | 0.0% | 0.0% | 22.5% |
| Emu2-Chat | 65.3% | 54.3% | 18.6% | 3.9% | 0.0% | 0.0% | 0.0% | 0.0% | 0.0% | 0.0% | 0.0% | 12.9% |
| Model | Counting-Text | |||||||||||
| 1K | 2K | 4K | 8K | 12K | 16K | 24K | 32K | 40K | 48K | 64K | Overall | |
| Human | 100.0% | 98.7% | 98.7% | 100.0% | 98.7% | 100.0% | 100.0% | 100.0% | 99.0% | 100.0% | 97.9% | 99.4% |
| Gemini-1.5 | 90.4% | 85.9% | 82.5% | 79.0% | 79.5% | 79.1% | 75.4% | 71.2% | 70.1% | 74.1% | 77.0% | 78.6% |
| GPT-4V | 70.0% | 90.4% | 84.7% | 84.1% | 82.2% | 72.8% | 73.6% | 64.6% | 55.6% | 53.6% | 77.6% | 73.6% |
| InternVL-1.5 (w.RAG) | 80.7% | 70.4% | 52.3% | 52.9% | 57.8% | 52.7% | 40.7% | 36.6% | 28.5% | 19.5% | 12.4% | 45.9% |
| InternVL-1.5 | 67.6% | 60.0% | 46.7% | 46.8% | 33.3% | 28.0% | 17.0% | 8.3% | 5.4% | 7.7% | 6.8% | 29.8% |
| LLaVA-1.6-13B | 33.7% | 32.4% | 30.6% | 33.6% | 21.1% | 6.5% | 1.6% | 0.2% | 0.3% | 0.0% | 0.0% | 14.6% |
| LLaVA-1.6-34B | 55.0% | 47.6% | 34.8% | 19.2% | 3.2% | 0.0% | 0.0% | 0.0% | 0.0% | 0.0% | 0.0% | 14.5% |
| VILA-13B | 25.5% | 15.4% | 14.8% | 11.2% | 0.4% | 0.0% | 0.0% | 0.0% | 0.0% | 0.0% | 0.0% | 6.1% |
| IDEFICS2 | 42.6% | 15.6% | 1.8% | 1.2% | 1.4% | 0.0% | 0.0% | 0.0% | 0.0% | 0.0% | 0.0% | 5.7% |
| Emu2-Chat | 3.2% | 0.8% | 0.5% | 0.2% | 0.0% | 0.0% | 0.0% | 0.0% | 0.0% | 0.0% | 0.0% | 0.4% |
| Model | Reasoning-Text | |||||||||||
| 1K | 2K | 4K | 8K | 12K | 16K | 24K | 32K | 40K | 48K | 64K | Overall | |
| Human | 100.0% | 98.0% | 98.4% | 97.7% | 100.0% | 98.4% | 100.0% | 100.0% | 100.0% | 97.5% | 97.7% | 98.9% |
| GPT-4V | 95.6% | 93.5% | 89.8% | 93.3% | 79.8% | 79.3% | 65.0% | 98.0% | 76.0% | 76.1% | 76.7% | 83.9% |
| Gemini-1.5 | 95.0% | 87.9% | 84.6% | 87.6% | 83.1% | 74.4% | 78.6% | 72.5% | 70.3% | 66.5% | 70.9% | 79.2% |
| InternVL-1.5 (w.RAG) | 89.4% | 86.6% | 79.2% | 66.4% | 63.8% | 69.4% | 63.9% | 61.0% | 64.1% | 59.0% | 58.9% | 69.3% |
| InternVL-1.5 | 85.6% | 78.3% | 75.7% | 59.3% | 60.6% | 52.1% | 44.9% | 32.4% | 33.3% | 29.9% | 22.3% | 52.2% |
| LLaVA-1.6-34B | 76.5% | 69.7% | 61.8% | 43.6% | 27.8% | 4.6% | 0.0% | 0.0% | 0.0% | 0.0% | 0.0% | 25.8% |
| VILA-13B | 64.9% | 51.9% | 47.4% | 35.6% | 24.5% | 5.2% | 1.2% | 0.0% | 0.0% | 0.0% | 0.7% | 21.0% |
| LLaVA-1.6-13B | 57.4% | 42.6% | 46.7% | 33.2% | 19.4% | 11.3% | 2.0% | 1.5% | 0.0% | 0.0% | 0.0% | 19.5% |
| IDEFICS2 | 73.6% | 48.1% | 17.1% | 11.7% | 10.1% | 1.2% | 0.0% | 0.0% | 0.0% | 0.0% | 0.0% | 14.7% |
| Emu2-Chat | 48.7% | 47.5% | 31.1% | 12.8% | 0.0% | 0.0% | 0.0% | 0.0% | 0.0% | 0.0% | 0.0% | 12.7% |
| Model | Retrieval-Image | |||||||||||
| 1K | 2K | 4K | 8K | 12K | 16K | 24K | 32K | 40K | 48K | 64K | Overall | |
| GPT-4V | - | - | - | - | - | - | - | - | - | - | - | - |
| Human | 100.0% | 97.8% | 98.0% | 96.4% | 97.8% | 97.8% | 100.0% | 97.8% | 100.0% | 95.8% | 97.3% | 98.1% |
| InternVL-1.5 | 25.0% | 24.4% | 26.4% | 26.2% | 33.1% | 31.4% | 31.4% | 28.5% | 25.2% | 30.6% | 26.4% | 28.0% |
| InternVL-1.5 (w.RAG) | 24.7% | 30.1% | 32.6% | 36.4% | 27.2% | 27.3% | 24.2% | 31.8% | 20.0% | 15.8% | 16.0% | 26.0% |
| Gemini-1.5 | 17.9% | 17.7% | 22.7% | 23.5% | 25.9% | 26.4% | 27.7% | 20.8% | 21.6% | 19.6% | 22.2% | 22.4% |
| LLaVA-1.6-34B | 57.3% | 51.5% | 43.4% | 34.6% | 23.1% | 9.8% | 0.0% | 0.0% | 0.0% | 0.0% | 0.0% | 20.0% |
| LLaVA-1.6-13B | 32.2% | 34.6% | 26.6% | 26.7% | 24.1% | 23.9% | 6.0% | 0.0% | 0.0% | 0.0% | 0.0% | 15.8% |
| VILA-13B | 28.8% | 29.1% | 31.1% | 24.7% | 29.8% | 9.6% | 0.0% | 0.0% | 0.0% | 0.0% | 0.0% | 13.9% |
| IDEFICS2 | 26.7% | 21.5% | 22.0% | 22.6% | 23.8% | 0.3% | 0.0% | 0.0% | 0.0% | 0.0% | 0.0% | 10.6% |
| Emu2-Chat | 26.3% | 23.6% | 14.8% | 0.7% | 0.0% | 0.0% | 0.0% | 0.0% | 0.0% | 0.0% | 0.0% | 5.9% |
| Model | Counting-Image | |||||||||||
| 1K | 2K | 4K | 8K | 12K | 16K | 24K | 32K | 40K | 48K | 64K | Overall | |
| GPT-4V | - | - | - | - | - | - | - | - | - | - | - | - |
| Human | 98.2% | 100.0% | 94.2% | 100.0% | 98.6% | 96.4% | 99.2% | 98.8% | 98.6% | 98.0% | 98.1% | 98.2% |
| Gemini-1.5 | 52.1% | 29.8% | 17.0% | 10.4% | 6.9% | 8.3% | 6.0% | 6.3% | 5.0% | 3.6% | 6.4% | 13.8% |
| LLaVA-1.6-13B | 12.0% | 20.2% | 31.7% | 23.1% | 12.3% | 5.5% | 1.0% | 0.0% | 0.2% | 0.4% | 0.0% | 9.7% |
| InternVL-1.5 (w.RAG) | 44.8% | 21.8% | 4.9% | 1.8% | 0.6% | 0.2% | 0.0% | 0.0% | 0.0% | 0.0% | 0.0% | 6.7% |
| InternVL-1.5 | 30.6% | 16.6% | 6.1% | 0.7% | 0.5% | 0.3% | 0.0% | 0.0% | 0.0% | 0.0% | 0.0% | 5.0% |
| VILA-13B | 0.0% | 3.9% | 5.6% | 6.7% | 7.1% | 1.9% | 0.0% | 0.0% | 0.0% | 0.0% | 0.0% | 2.3% |
| LLaVA-1.6-34B | 1.3% | 0.3% | 0.4% | 1.1% | 6.0% | 1.2% | 0.0% | 0.0% | 0.0% | 0.0% | 0.0% | 0.9% |
| Emu2-Chat | 0.0% | 0.0% | 1.1% | 0.2% | 0.0% | 0.0% | 0.0% | 0.0% | 0.0% | 0.0% | 0.0% | 0.1% |
| IDEFICS2 | 0.0% | 0.0% | 0.0% | 0.4% | 0.1% | 0.0% | 0.0% | 0.0% | 0.0% | 0.0% | 0.0% | 0.0% |
| Model | Reasoning-Image | |||||||||||
| 1K | 2K | 4K | 8K | 12K | 16K | 24K | 32K | 40K | 48K | 64K | Overall | |
| GPT-4V | - | - | - | - | - | - | - | - | - | - | - | - |
| Human | 100.0% | 100.0% | 98.0% | 100.0% | 95.7% | 100.0% | 100.0% | 100.0% | 97.5% | 100.0% | 100.0% | 99.2% |
| InternVL-1.5 (w.RAG) | 65.9% | 58.3% | 51.5% | 50.8% | 56.4% | 62.7% | 52.1% | 51.4% | 55.9% | 51.2% | 52.0% | 55.3% |
| InternVL-1.5 | 49.2% | 52.8% | 49.5% | 50.1% | 51.3% | 48.5% | 53.2% | 48.9% | 44.4% | 51.1% | 52.2% | 50.1% |
| Gemini-1.5 | 39.6% | 38.9% | 45.1% | 52.3% | 49.7% | 49.1% | 45.7% | 53.7% | 60.9% | 54.1% | 54.3% | 49.4% |
| LLaVA-1.6-13B | 50.1% | 49.2% | 45.7% | 54.1% | 50.7% | 39.1% | 21.0% | 2.4% | 0.0% | 0.0% | 0.0% | 28.4% |
| VILA-13B | 55.6% | 49.0% | 51.4% | 53.1% | 55.1% | 30.0% | 4.8% | 1.1% | 0.0% | 0.0% | 0.0% | 27.3% |
| LLaVA-1.6-34B | 58.8% | 55.4% | 52.2% | 55.7% | 48.1% | 29.2% | 0.0% | 0.0% | 0.0% | 0.0% | 0.0% | 27.2% |
| IDEFICS2 | 49.8% | 27.1% | 25.6% | 35.3% | 35.3% | 2.7% | 0.0% | 0.0% | 0.0% | 0.0% | 0.0% | 16.0% |
| Emu2-Chat | 54.3% | 40.9% | 37.2% | 17.6% | 5.1% | 0.0% | 0.0% | 0.0% | 0.0% | 0.0% | 0.0% | 14.1% |
| Model | Overall | |||||||||||
| 1K | 2K | 4K | 8K | 12K | 16K | 24K | 32K | 40K | 48K | 64K | Overall | |
| GPT-4V | - | - | - | - | - | - | - | - | - | - | - | - |
| Human | 99.7% | 99.1% | 97.9% | 99.0% | 98.5% | 98.8% | 99.9% | 99.4% | 99.2% | 98.6% | 98.5% | 98.9% |
| Gemini-1.5 | 64.7% | 58.3% | 56.8% | 57.1% | 55.4% | 53.7% | 53.6% | 51.9% | 52.5% | 50.7% | 53.6% | 55.3% |
| InternVL-1.5 (w.RAG) | 67.5% | 61.1% | 53.3% | 51.2% | 50.6% | 51.5% | 46.2% | 46.2% | 43.8% | 40.1% | 39.0% | 50.1% |
| InternVL-1.5 | 59.5% | 55.3% | 50.1% | 46.4% | 45.2% | 41.9% | 39.5% | 33.2% | 31.6% | 33.2% | 30.1% | 42.4% |
| LLaVA-1.6-34B | 57.9% | 53.5% | 47.1% | 38.6% | 27.0% | 8.2% | 0.0% | 0.0% | 0.0% | 0.0% | 0.0% | 21.1% |
| LLaVA-1.6-13B | 47.0% | 45.0% | 41.6% | 35.0% | 24.3% | 15.5% | 5.7% | 0.8% | 0.2% | 0.1% | 0.0% | 19.6% |
| VILA-13B | 44.7% | 39.3% | 34.9% | 28.3% | 22.0% | 8.9% | 1.1% | 0.2% | 0.1% | 0.0% | 0.1% | 16.3% |
| IDEFICS2 | 48.0% | 33.8% | 16.4% | 13.8% | 14.3% | 1.2% | 0.0% | 0.0% | 0.0% | 0.0% | 0.0% | 11.6% |
| Emu2-Chat | 33.0% | 27.8% | 17.2% | 5.9% | 0.9% | 0.0% | 0.0% | 0.0% | 0.0% | 0.0% | 0.0% | 7.7% |